Every year, the stock market pays its owners a return. Some investors try to beat it by picking the right stocks or the right fund manager; others simply buy the whole market through an index fund. It feels natural to think that, with enough skill and effort, the first group should come out ahead.
In this post, I will explore a piece of arithmetic that says otherwise, at least for investors as a group. It was made famous by John C. Bogle, the founder of Vanguard, and it is so simple that it is very hard to argue with.
Who Is “the Market”?#
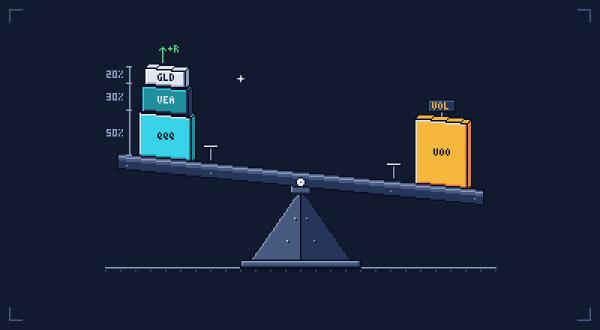
The market return is the return of all stocks together, each counted in proportion to its total value (its market capitalization: share price times number of shares). An index fund that holds every stock in exactly those proportions earns the market return, minus its (small) costs.
The economist William F. Sharpe split all investors into two groups in a three-page article, “The Arithmetic of Active Management” (1991):
“A passive investor always holds every security from the market, with each represented in the same manner as in the market.” […] “An active investor is one who is not passive.” — William F. Sharpe, 1991
Notice how broad “active” is: anyone who holds anything other than the whole market, from individual stock pickers to mutual funds, hedge funds and pension funds.
Before Costs: A Zero-Sum Game#
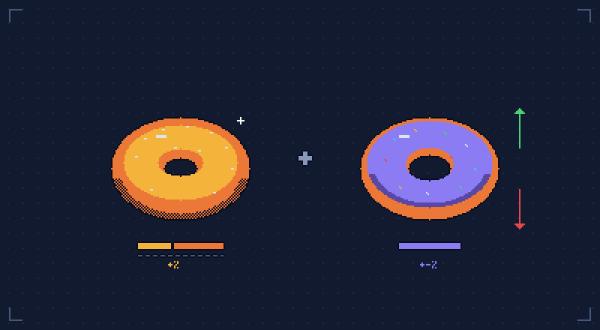
Here is the key observation. All investors together own the whole market, so their combined return is the market return. The passive investors hold a slice of every stock in market proportions, so they earn exactly the market return. That leaves the active investors: if the whole earns the market return, and the passive part earns the market return, then the active part must earn the market return too.
Let’s make this concrete with a tiny market (my own toy numbers). The market is worth $300 and returns 10% this year. It has three investors who each start with $100:
- Cara is passive: she holds a one-third slice of every stock.
- Ann and Ben are active: they own the other two-thirds between them and trade with each other, each trying to hold the better stocks.
By the end of the year, Ann happens to hold the stocks that rose 13%, and Ben the stocks that rose only 7%. Cara ends with $110, Ann with $113 and Ben with $107. Ann and Ben together have $220, exactly 10% more than their $200. Ann’s 3 points above the market are exactly Ben’s 3 points below it.
This is a zero-sum game: one active investor can only beat the market if another active investor trails it by the same amount. Sharpe put it in one sentence: before costs, “the return on the average actively managed dollar will equal the return on the average passively managed dollar.” And this, he wrote, depends “only on the laws of addition, subtraction, multiplication and division. Nothing else is required.”
One note to avoid a misunderstanding: owning stocks is not zero-sum. As Bogle wrote in The Little Book of Common Sense Investing, capitalism “creates wealth, a positive-sum game for its owners.” What is zero-sum is beating the market.
After Costs: A Loser’s Game#
So far, nobody has paid anything. In real life, trying to beat the market costs money: fund management fees, trading costs, advisers. Passive investing costs money too, but much less.
Let’s add costs to our tiny market. Suppose Ann and Ben each pay 1.5% a year, and Cara pays 0.06% for her index fund:
| Investor | Return before costs | Costs | Return after costs | End value ($) |
|---|---|---|---|---|
| Cara (passive) | 10% | 0.06% | 9.94% | 109.94 |
| Ann (active) | 13% | 1.5% | 11.5% | 111.50 |
| Ben (active) | 7% | 1.5% | 5.5% | 105.50 |
| Ann + Ben (all active) | 10% | 1.5% | 8.5% | 217.00 |
Table 1. A three-investor market returning 10%: before costs the active pair earns exactly the market; after costs it trails the market by exactly what it pays
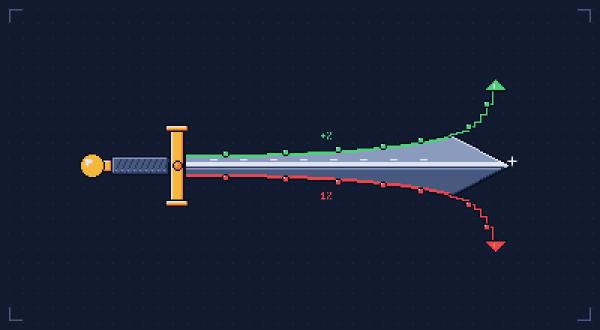
Before costs, the active pair matched the market. After costs, it trails the market by exactly its costs: 8.5% instead of 10%. Ann still beat the market, but only because Ben did much worse. The difference went to what Bogle called the croupier, the casino employee who rakes in the house’s cut: here, everyone who charges investors fees.
This is Sharpe’s second claim: after costs, “the return on the average actively managed dollar will be less than the return on the average passively managed dollar.” Bogle gave the same rule a name in a 2005 talk to the American Association of Individual Investors:
“I call it the CMH—the Cost Matters Hypothesis—the iron rule that investors as a group must always lose to the stock market by the amount of the costs they incur.” — John C. Bogle, 2005
In the same talk, he compared it to a casino: “just as gambling in the casino is a zero-sum game before the croupiers rake in their share […] so beating the stock and bond markets is a zero-sum game before intermediation costs, and a loser’s game thereafter.” (The phrase “loser’s game” comes from Charles D. Ellis’s 1975 essay “The Loser’s Game”.)
The Croupier’s Take in Real Life#
How big are real costs? In a 2014 article, Bogle added up everything an investor in an average actively managed fund pays in a year: the fund’s expense ratio, its trading costs, the drag from holding some cash instead of stocks, and sales charges and adviser fees. He arrived at 2.27% a year. For an index fund, he estimated 0.06%.
That sounds small, but let’s use the same illustrative 10% market return as in my post The Double-Edged Sword of Compounding. The average active fund investor keeps 10% - 2.27% = 7.73% a year, about 77% of the market’s return. The index fund investor keeps 9.94%, over 99% of it.
And just as in the compounding post, costs compound. Here is what happens to $10,000 over 50 years:
Figure 1. $10,000 over 50 years at an illustrative 10% market return, minus Bogle’s estimated all-in costs: 0.06% a year for an index fund, 2.27% for an average active fund
After 50 years, the market has turned $10,000 into $1,173,908.53. The index fund investor ends with $1,142,316.98, over 97% of it. The average active fund investor ends with $413,840.50, about 35% of it. The croupier took less than a quarter of each year’s return, but almost two-thirds of the final pot.
You Don’t Need Efficient Markets for This#
To me, this is the strongest and least-known part of the argument. Many people think the case for index funds rests on the efficient-market hypothesis, which Bogle described in the same 2005 talk as the idea “that most stocks are fairly valued, most of the time.” If prices were often wrong, the reasoning goes, skilled investors could profit.
But look again at Ann and Ben. Nothing in the example required prices to be right. Maybe Ann spotted a bargain that Ben missed. Even so, her gain was exactly his loss. Mispriced stocks change who wins among active investors, not how the group does on average. That is why Bogle said the arithmetic reminds us of “something both more certain and more profound than the EMH.”
Can You Find Ann?#
So far, we have seen that the average active dollar must trail the market by exactly what it pays. Many investors would happily agree and still reply: “Fine, the average lags. But Ann beat the market. What if I find an Ann to invest for me?”
It is a fair question, because Anns do exist: in our tiny market, Ann beat the market even after paying her costs, and Sharpe himself wrote that “it is perfectly possible for some active managers to beat their passive brethren, even after costs.” The arithmetic only says that the winners’ gains come from other active investors, and that everyone pays the croupier. The real question is how many Anns there are, and whether you can pick one in advance.
The best-known scoreboard is S&P Dow Jones Indices’ SPIVA U.S. Scorecard, which compares active funds with the index they try to beat. Here is the share of active U.S. large-cap funds that beat the S&P 500, an index of about 500 large US companies, over periods ending in December 2025:
Figure 2. Share of active U.S. large-cap funds that beat the S&P 500, over periods of 1 to 20 years ending in December 2025; funds that closed along the way count as not beating it (S&P Dow Jones Indices, SPIVA U.S. Scorecard Year-End 2025)
Over a single year, about one fund in five beat the index. Over 20 years, only 7.11% did. Finding an Ann gets harder the longer you need her, and a retirement saving plan needs her for a long time.
Why does it get harder? Whatever edge a fund may have, its costs are paid every single year, and, as we saw above, they compound. The longer the period, the bigger the head start the index builds up, and the fewer funds manage to overcome it.
Even the funds that do win are hard to spot at the start. Only about a third of the funds that began the 20 years were still around at the end; the rest were closed or merged into other funds along the way, often after doing badly.
So here is the question I would ask myself: would I really bet my financial future, and a comfortable retirement, on a less than 1-in-10 chance of picking, today, an Ann who will still be beating the market 20 years from now?
Caveats#
Caveat 1: The Numbers Are Illustrative#
The 10% market return is a round number for illustration, and Bogle’s 2.27% and 0.06% are his estimates for an average active fund and an index fund; a particular fund can cost more or less. The exact numbers matter less than the gap between them, which compounds whatever its size.
Caveat 2: How You Count Changes the Score#
The fund data above count every fund equally and compare each fund with an index, which has no costs. A recent study, reviewed by Morningstar, counted differently: it weighted funds by the money in them and compared them with real index funds, fees included. For the 10 years to 2024, that turned almost 90% of active U.S. stock funds lagging their index into about 63%, though Morningstar’s review was not convinced by the method. Either way, most active money still lagged, so finding an Ann stays hard: the counting changes “almost all” into “most”.
Caveat 3: What If Everyone Indexes?#
Index funds rely on active investors to set the prices they buy at, so if everyone indexed, nobody would be left to do that work. Economists have long argued that some reward for doing it must therefore survive (the Grossman–Stiglitz paradox). That is a limit on how far indexing can go, not a hole in the arithmetic: whatever active investors earn as a group, they still earn from each other, before paying their costs.
Summary#
Before costs, beating the market is a zero-sum game: every point one active investor gains above the market, another loses. After costs, it is a loser’s game: investors as a group must trail the market by what they pay, and that gap compounds just like a fund fee. None of this requires markets to be efficient; it only requires arithmetic. Some active investors do win, but real fund data show how hard it is to pick them in advance: over 20 years, fewer than one active U.S. large-cap fund in ten beat the S&P 500. The arithmetic is William F. Sharpe’s, and the croupier and the Cost Matters Hypothesis are John C. Bogle’s.
Disclaimers#
I am not a professional investor or financial advisor, nor do I claim to be. You are solely responsible for your financial decisions. I do not accept responsibility for any inaccuracies in this blog post. The content reflects my personal research and understanding and should not be interpreted as professional advice.